Your plant managers know which lines are overworked. The shop floor knows which machines are under-utilized. But as an executive, do you have a single view of your total production capacity?
Capex decisions involve millions. You need a centralized dashboard.
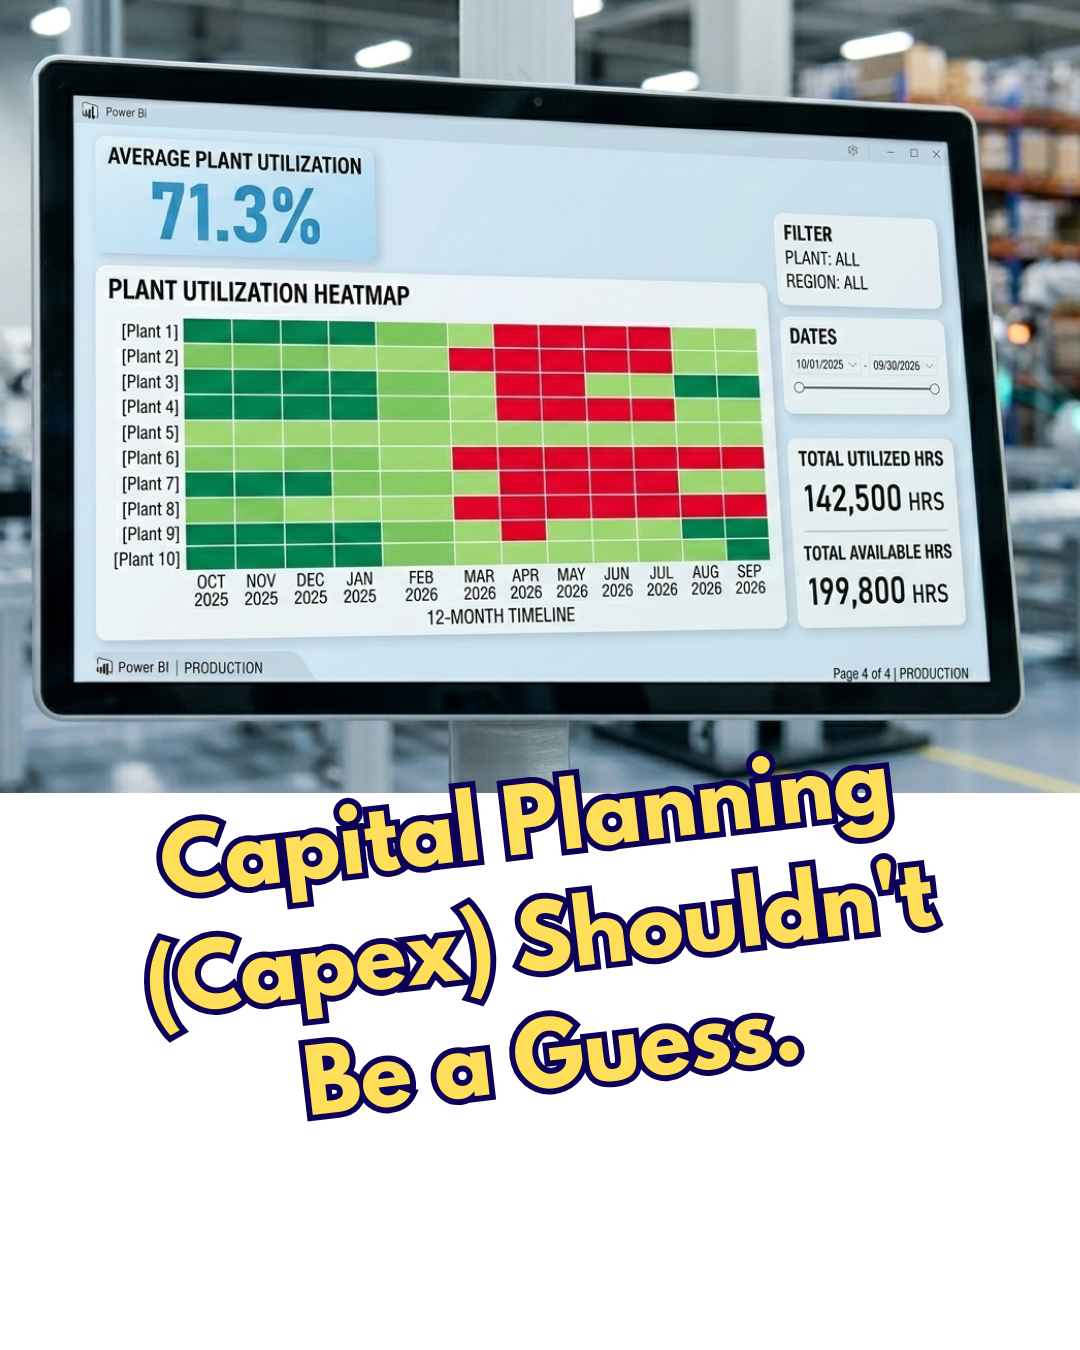
I build Power BI Production Capacity Heatmaps for executive strategic planning.
This report helps you visualize:
📌 Overall Utilization: A unified view of current throughput against maximum capacity.
📌Under-Utilized Assets: Where can you shift work without spending a dollar?
📌Heatmaps: Instant red/green color-coding that highlights the exact plant or line that is over-committed.
📌Move from intuition to intelligence when planning the future of your operations.
Ready to get a high-level strategic view of your floor? 👇 DM us to discuss the reports that executives actually want to see.