Paper logs and delayed reports don’t cut it anymore. If you’re only analyzing your manufacturing performance days or weeks later, you are competing on historical data, not current efficiency.
Introducing the Power BI OEE Real-Time Tracker.
🛠️ Shift From Reactive to Proactive Operations:
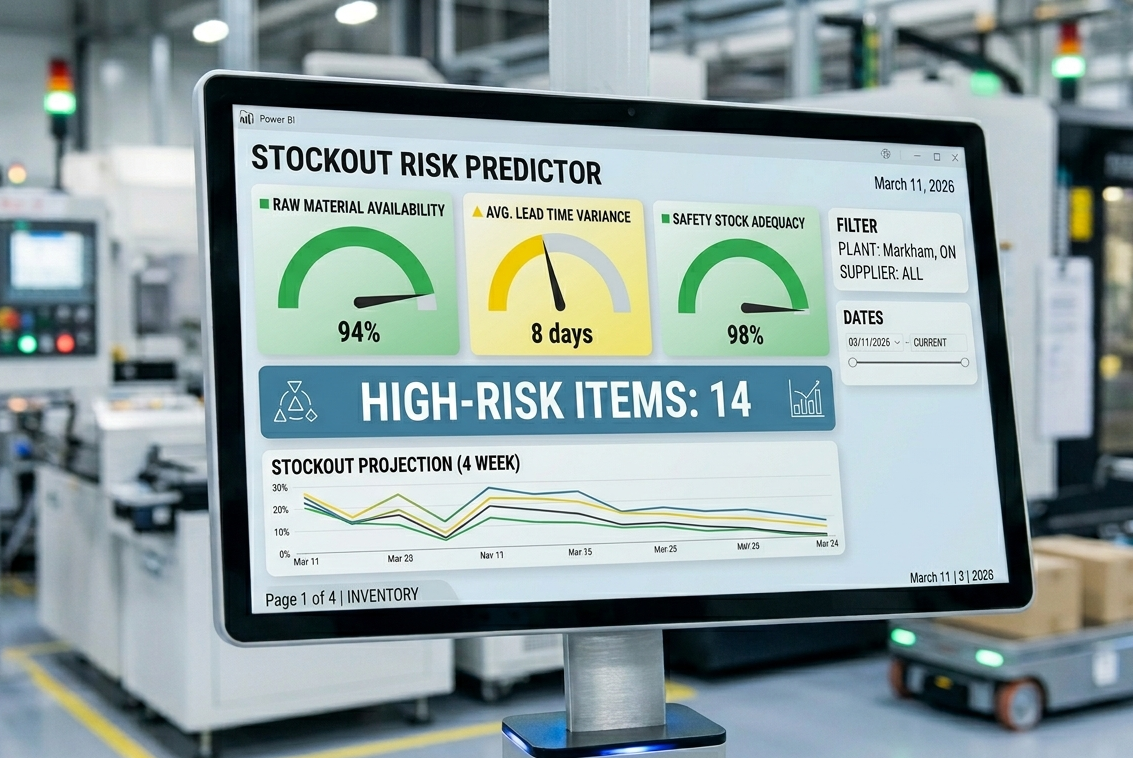
-Instant Visibility: Know your line performance right now, not after the shift ends.
-Granular OEE Breakdown: Visualize Availability, Performance, and Quality KPIs in one centralized view.
-Rapid Bottleneck ID: Spot falling output or rising downtime as it happens to fix issues faster.
-Operator Empowerment: Give the shop floor real-time targets they can actually influence.
📊 The Bottom Line:
Moving to a real-time Power BI reporting system typically leads to a 5-10% improvement in Overall Equipment Effectiveness by reducing unexpected downtime and improving throughput.
Don’t wait to optimize. Turn your data into a competitive advantage.
Ready to see your line performance in high definition?
👇 Drop a “DEMO” in the Contact US form to see how we can tail or this Power BI dashboard for your production facility.